Jupiter’s Great Red Spot – Could it be gone in 20 years?

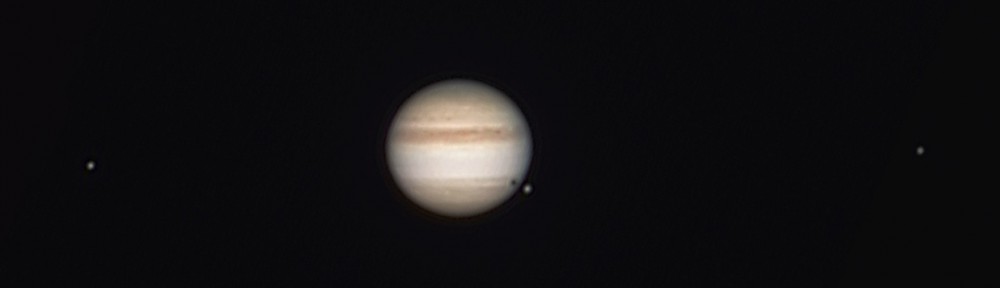
One of the great targets for backyard astronomers is Jupiter, and spotting its moons, the cloud bands and the Great Red Spot is always a treat. Observations over a few days provides a good view into the dynamic nature of the clouds and the orbits of the Moon.  I haven’t yet managed to capture the Great Red Spot on photo, but maybe this fall as Jupiter comes back into view in the evening sky, I should make the effort to spot the GRS.  This is because ever since it’s discovery in the 1800s, it has been shrinking in size.  And at the current rate, it could be gone all together in as little as 20 years!

Jupiter's Great Red Spot (1995 and 2014) - NASA

Jupiter’s Great Red Spot (1995 and 2014) – NASA

In the last 10 years it has shrunk by 3000km, taken a more circular form and increased its rotational speed.  Amateur observations since 2012 have revealed that this phenomenon is even accelerating, shrinking by as much as 930km per year.  Current measurements have the GSR now pegged at under 15,000km in diameter.

As we head into the fall, Jupiter will become easier to observe.  By December Jupiter will be high in the sky around midnight. On February 6th, Jupiter will be at Opposition, fully illuminated by the Sun and at its closest to the Earth.

The photo in the title bar was taken by me back in September 17th, 2010, only 4 days before its closest approach, which shows that even with a small 80mm scope, quite a bit of detail can be captured when the conditions are right.

Clear Sky Chart – Can I take my gear out?

We are all dependent on the weather, and knowing what Mother Nature has in store for us in the next 24hrs helps our daily routine.  Backyard astronomers don’t have the luxury to be setup on top of a mountain range, above the clouds where the air is crisp and dry all the time.  Therefore knowing in advance if it’s worth hauling out all your gear for a six-hour deep-sky photo-session or a minimalist setup to scan the planets and the Moon can save lots of frustration.

One of the great tools out there is Clear Sky Chart.

Clear Sky Chart

Clear Sky Chart

Using data and forecasting models from Environment Canada specifically tailored for astronomers the site provides a simple chart with past, current and forecasted conditions of various parameters that affect the viewing quality.  In the above snap-shot cloud cover, transparency and humidity all indicate bad viewing conditions for Friday and Saturday night. (Boooo…..)

While the data is from Environment Canada, Clear Sky Chart provides coverage for the USA and part of Mexico.  On the web site you can select the closest observation site, or request to create your own.  If your setup is mobile, you can check the viewing conditions at various locations to see if it’s worth to pack up your gear for a road-trip to a place with less light pollution and better weather.

An Android app is also available for your mobile devices and tablets: Clear Sky Droid, essentially using the same charts and data set.

Clear Sky Droid

Clear Sky Droid

As the saying goes: Clear and dark skies!